· 4 min
How to measure a developer community programme
A practical measurement model for developer community programmes: four metric families, how to define them, and how to report them without overclaiming.
The most common question we get from heads of community is not about growth. It is "how do we show this is working?" Close behind it comes the harder version: how to show it without overclaiming and losing credibility with finance.
Both have the same answer, and this post sets it out: a measurement model agreed before launch, with four metric families, honest attribution windows and a reporting cadence.
Why it matters
A community programme is funded on the numbers that someone outside the team believes. Programmes that report only activity look like hobbies. Programmes that claim every deal look like fiction, and once finance catches one inflated number it stops trusting the true ones.
The model has to be agreed before launch, for the same reason we give in developer advocacy is a growth system: definitions written after the results arrive look like they were written to fit them.
Every metric fits one of four families
Every community metric we track fits one of four families. Report them in order, and put the most weight on the first two.
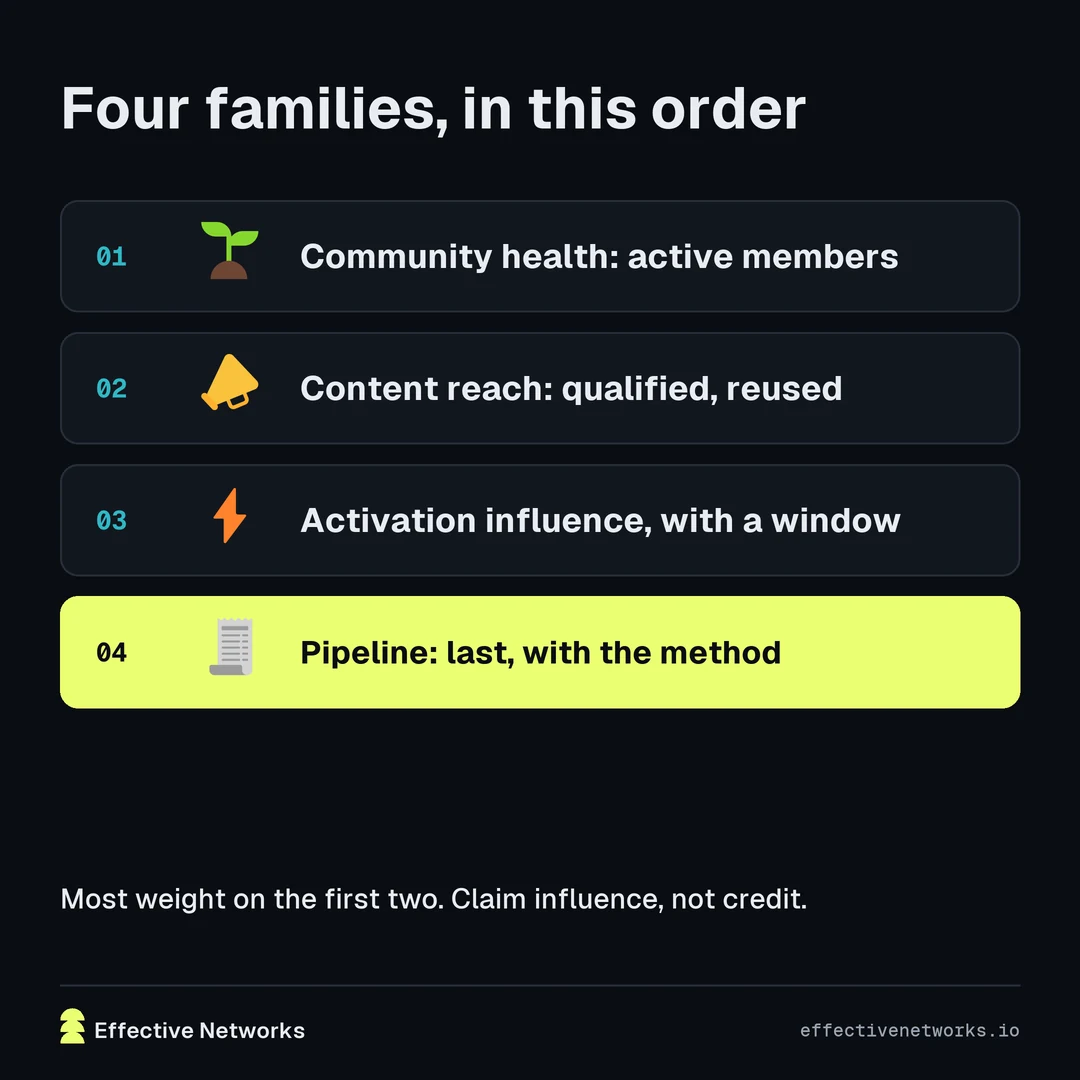
1. Community health
These describe whether the community is alive and worth belonging to.
- Active members (30-day and 90-day). Members who posted, answered, attended, or contributed in the window. Never report total sign-ups as a headline number.
- Champion retention and progression. Of last year's cohort, how many are still active, and how many moved up a tier?
- Regional coverage. Regions with a named leader and a quarterly event cadence that held.
- Response time and answer rate. Median time to first answer, and share of questions resolved by the community.
2. Content reach
Communities produce content. Track it like a publisher would.
- Contributor output through the review workflow, and how long review took.
- Qualified reach: sessions from practitioner audiences, by region, not raw impressions.
- Reuse: how often docs, sales, and support link to community-produced content.
3. Activation and adoption influence
This is where community starts to connect to the business. The word is influence, and the honesty is in the window.
- Activations with a community touchpoint: a product activation event within N days after the user attended, posted, or consumed community content. Choose N with your analytics team and publish it.
- Feature adoption after programme content: the adoption rate of a feature among users who saw the community tutorial versus those who did not.
- Certification completions, when a certification programme exists.
- Support deflection: ticket volume on topics the community now answers.
4. Pipeline attribution
Report this last, report it conservatively, and report it with the method attached.
- Community-sourced opportunities, where the first touch was a community interaction.
- Community-influenced opportunities, with at least one community touchpoint before close.
- Expansion in accounts with active champions, compared with accounts without.
Claim influence, not credit
Three rules keep this credible.
- Publish the definitions. Every metric in the quarterly business review (QBR) has a one-line definition and a data source. Finance can audit it.
- Use influence, not credit. Community rarely deserves sole credit for a deal. Claim influence with a window and let sales keep the close.
- Show the comparison and its limits. Influence numbers mean nothing without a baseline: users without a community touchpoint, accounts without a champion. Then account for the differences in tenure, intent and account size, because the most active users may have been the most likely to join anyway. A comparison shows association, not cause.
Report on a cadence people can plan around
- Weekly, an operations standup: moderation queue, contributor queue, upcoming events.
- Monthly, a two-page health report: family one and two metrics, notable incidents, next month's plan.
- Quarterly, the business review: all four families, trend lines, risks, and a next-quarter plan with asks.
- Annually, a strategy refresh and member survey.

Instrument it before you launch
You cannot report what you did not instrument. Before launch:
- Community platform events flowing to your analytics warehouse with a stable member ID.
- A way to join member IDs to product accounts (with consent and a privacy review).
- Event registration data tied to the same ID.
- Content analytics segmented by referrer and region.
- A field in your customer relationship management (CRM) system for community touchpoints that sales can see.

The takeaway: credible beats impressive
If you are launching a programme in the next ninety days, pick two metrics from each family, define them in writing, and get sign-off from the people who own the budget. Report them monthly for a quarter. Then have the QBR.
You will not have impressive numbers after one quarter. You will have credible ones, and credibility is the only thing that funds year two.
Which two would you pick from the first family?
We help teams design and run this measurement model as part of every programme we operate. See our global community programmes or talk to us.